Betfair trading strategy : Backing the steamer
So how would you find a steamer?
One of the things that happens often at large meetings is when you get a jockey trainer gamble. If somebody wins a couple of races or a jockey like Frankie Dettori wins a race, then people may have a tendency to start backing the next one anticipating that it is going to be backed and then they may follow that up if he wins again.

There are a number of ways of identifying where potential interest is within a market, but when you actively look at a steamer, it doesn’t have to occur this way. They can occur organically, naturally – things can happen that encourage people to bet on a horse.
Typically what you’re looking for, even if you didn’t know who Frankie Dettori was and that they did run the previous three races, you’d be looking for consistent backing.
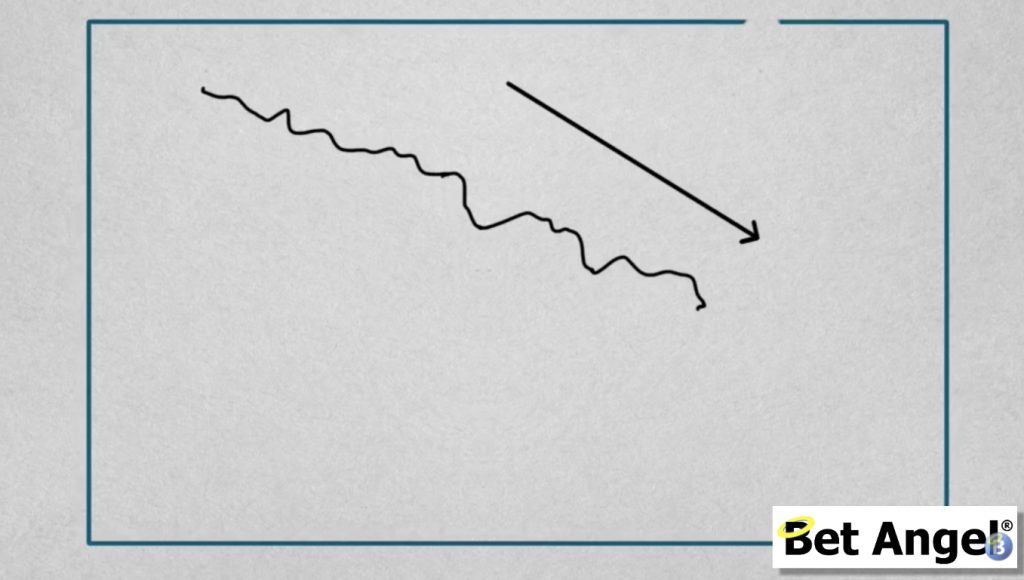
So in these scenarios, there’s a certain type of behaviour in the market. When you’re looking at horse racing, you can ‘see’ persistent backing. The price on the favourite is basically going to start high and then gradually work its way in.
It may be a little bit erratic, but you just see these repeat back orders gradually pulling the price further and further down.
The easy way to spot a steamer
KEY : You’re looking for consistent backing within the market.
Now you obviously want consistent backing, but if it reaches a certain point within the market and stalls, then you may find that it actually ends up reversing.
So typically what you’re looking for within a market is for a consistent steamer to be able to break support. It reaches a critical point in the market but just passes straight through. That indicates to you that nobody’s willing to lay it and that the money will continue to go down on this runner, pulling the price further down.
So consistent backing and breaking support are two key things that you should be looking for with the steamer, but also you’re looking for supporting evidence as well.
Now, what’s going to stop the favourite from heading much lower? Is there something happening somewhere else within the market or maybe even pictures from the course? Maybe the horse is just not looking particularly comfortable or commentators are saying things like ‘the horse is looking a bit frisky on the way to the start’ or the ‘horse isn’t not leaving the parade’ etc.
Go in with a specific strategy, but then immediately start looking for evidence that will support your position in the market.
Spotting a steamer
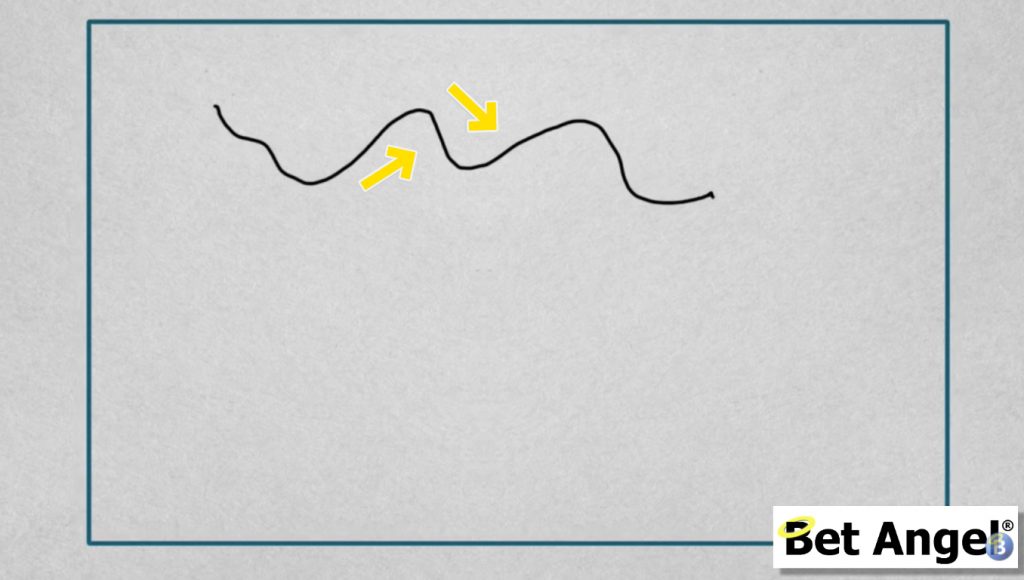
When you’re looking at backing a steamer you expect the price to gradually move down in some form or another, but there are many such patterns in the way that it moves. Now obviously, if more people are backing than laying, then the price has to come down. So essentially what you’re looking for was backing activity in the market in some way or another.
By looking at the ladder it will give you an indication as to if you’re seeing backing activity. But typically, something that looks like this is not particularly uncommon.

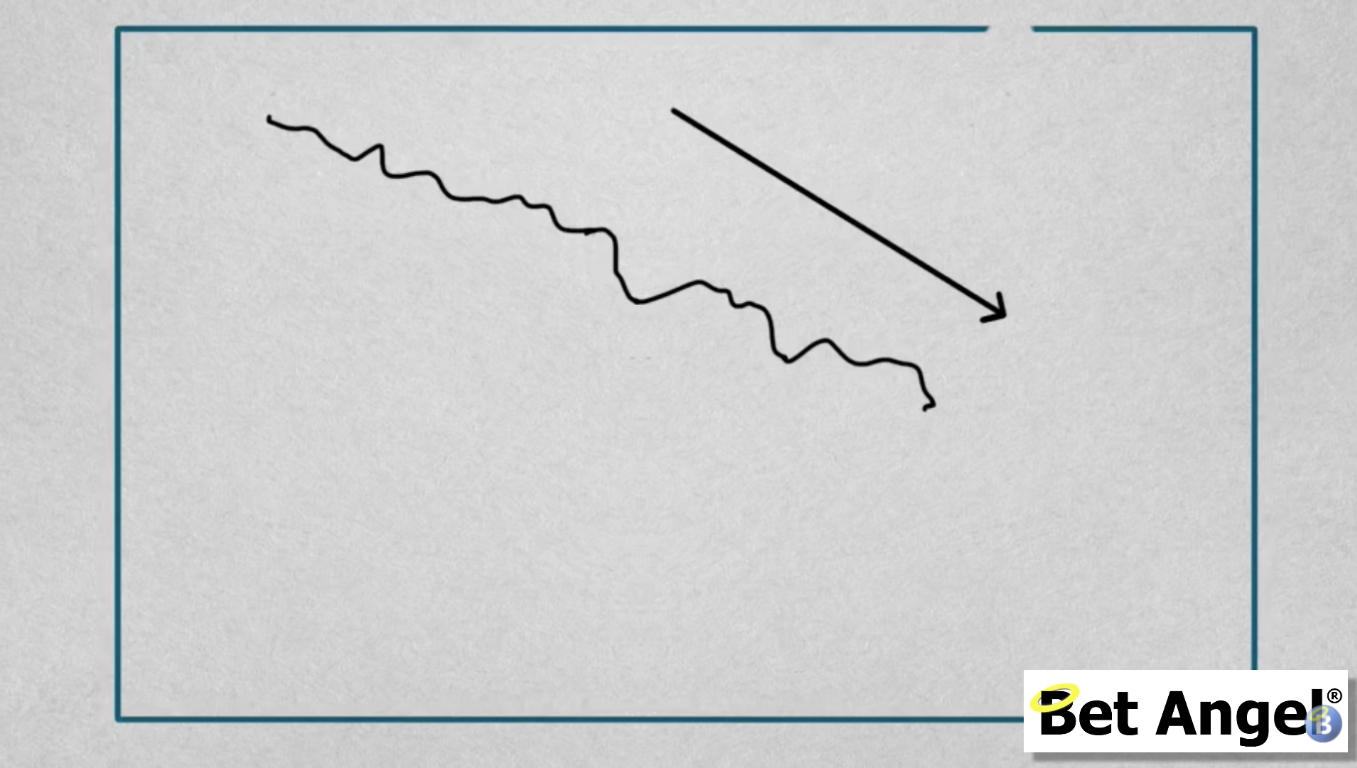
Very often you see a sort of BOOM and the price goes out and then – BOOM then the price goes again! Now you could also see a period of stability and then the price comes in and then it sort of retrenches and then carries on like in the gif above, but essentially what you’re looking for is a fairly consistent downward movement.
If you’re watching the ladder frequently enough you’ll be able to get a feel for it. You’ll see activity building in the market where it is pushing the price down. Now there are several patterns that develop that that give you a clue as to how this is happening.
If you see the markets that are doing what the image shows above then obviously, there’s a slight bias, but not a significant one. As I’ve said in the past, you have to grade each opportunity as you see it. If we start to put together a few of the things that we’ve talked about already in this blog post, then hopefully you’ll be looking at something that is generally trending down.
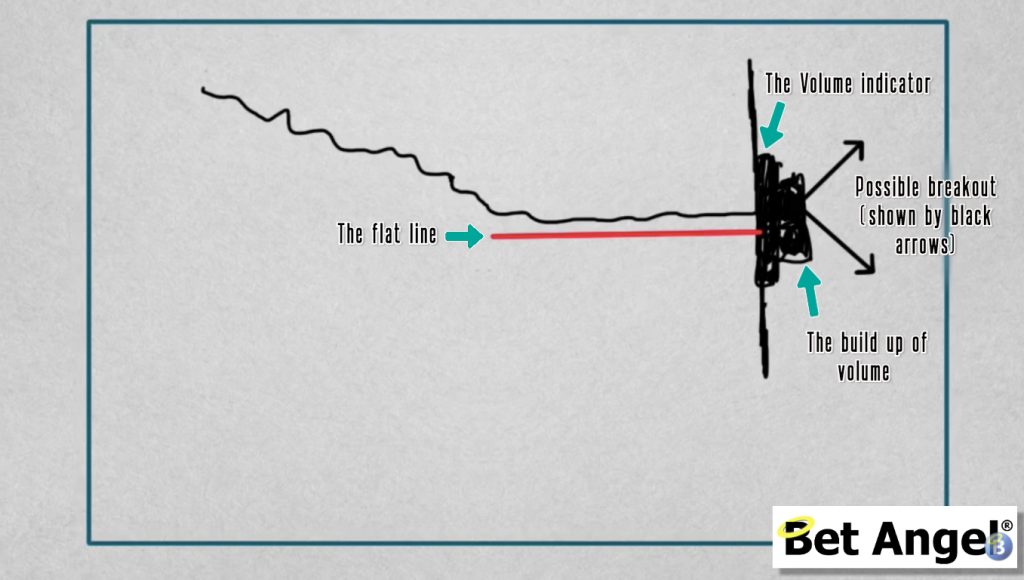
Now, what can happen now and again is it trends down for a period and then it’s sort of flat lines. So what tends to happen when the market stays at the same price for a period of time is that you tend to sort of get a build up of volume at that particular point within the market. Here we see an amount of money that’s getting matched and this tends to congregate at one particular point or another.
At this particular point, you’re looking for a breakout at this particular moment in time. Firstly, we’re looking for a steamer or a for consistent backing for example, but all of a sudden the market gets stuck in a certain point and volumes accumulating in one direction or another.
Now if the market’s stuck for a while, then you may find that it will start to break down. So if you get a large order that breaks the price further, then you can sort of think, well, okay, this probably is heading in that direction. You could also see the price tend to go up, typically will sort of bounce one way or the other.
So if you see the price come down and then it sort of meanders above the flat line in the market and you’ll see it bounce (shown in the gif above where it influxes on the flat line.) Each time that you see it bounce at these individual points it’s getting less and less likely that the market is going to continue in the trend in which it was going.
When you see it bouncing like this you’re thinking I’m not too sure where’s it going? You might think it’s probably going to go up etc. Here you’re forming a judgement on what the market is doing. You’re basically saying it’s looking more and more likely that something like that is going to happen.
So really what you’re looking for is for the price to head below the key point and then go up and touch and then maybe that will continue onwards from there (like shown in the gif above.) So around that particular level, you’ll begin to understand that it’s hitting a point of support or resistance at that particular moment in time. Then you can take your cue as to where you go from there.
But also think about it, if you see a market that exhibits this type of activity there’s no reason why you couldn’t do a trade in the other direction. You could basically decide to wait for the price to come down and then price will head off in the other direction. Here you’re talking about doing a swing trade, looking for a reversal or a bounce depending upon how much time you’ve got left within the market.
When you get to this scenario where the market begins to stall, then you’re either going to have to say maybe I need to exit my trade or you need to look for confirmation as to whether the price is going to continue to push on below this particular level. So you need to see continued backing or you need to see the market bouncing around below where most of the money is within the market.
If there’s a big chunk of money at the build up of volume as we head towards post time, that money will increase. However, it will tend to develop in a direction of some sort or another. You can get a clue when the market begins of stagnate like that.
Ideally, you want a strongly trending market which is pictured above. You want a market where there’s significant amount of money coming for a runner and you’re sort of seeing our repeated backing within the market.
As time goes on, you can begin to identify all of the key characteristics, but maybe stick with one when you first do it. That is fairly clear and obvious and start looking for that rather than confuse itself with all of the other patterns that can develop.
TIP: Try and keep an eye out for a persistent pattern in one direction.
If the market stalls at one particular point you’re really looking for the price to maybe bounce up towards that level, but not beyond it. You could probably say that if that point is well above where you are at the moment, that probably brings you a little bit of safety, but it’s below where you are at the moment, then that may actually hold that particular trend.
Define your traded range
Now, when you’re actually in a trade, it makes perfect sense to define what you’re going to do. This is where you decide that you’re going to get in a certain point within the market because all of the characteristics that you wanted are present, but at the moment that you get into your trade, you’re beginning to define a point at which you will place your closing traits.
You see me do this all of the time. I’ll say, ‘well, I think we’re in here, so I think it’s going to go up there and therefore, this is where I’m gonna put my closing trades. ‘
But I’ll also look behind my current position and say, ‘well, this is where I’ll define this trade as having gone wrong.’
Now, it doesn’t make sense typically to just have a a rigid boundary, because if something happens somewhere else in the market, you may want to be a little bit flexible. Now that’s why you see me break up trades as well, because if I’m confident that the trade is going well, I’ll put more trades in and if I think it’s going to go further than I expect, then I’ll just slow down my exit.
This is why you see me trade the way that I do, because what I’m trying to do is to get in the market roughly the right point and out at roughly the right point. But I’m leveraging and maximising the opportunity that I have within that market.
So if I think it’s gone really disastrously wrong I’ll just dump everything straight away.
Generally, that’s not the case because I’m very good at getting the right entry points within the market! Once you’re in the market, you have to define what that range will be because that will define your expectancy in the longer term as well.
Remember: it’s important that you actually have an idea of what you’re going to do and when, and that will help you execute better trades as well.
If you just turn up at a market and guess, you are never going to improve. That is why you need to come up with a strategy and then clearly define your entry and exit points, generally in terms of what you will do, when and why. If you have a set of rules then you can start practising with them.
The more you practice, the better you will get.