
Visualising sports trading data
You may have noticed my regular theme of visualising data. Why do I do this?
The reason is simple, it’s easy to pick up patterns when you are looking at them visually. If you have to plough through billions of rows of spreadsheets, pivot tables or outputs from a database, you may find some of the more obvious patterns may elude you due to number blindness. Visualise it and it often leaps right out at you.
Bet Angel contains a number of tools that allow you to do this by making it easy to collect, store and analyse data across multiple markets. I use Guardian the it’s multi market spreadsheet capability to gather data as I trade. Using Guardian you can do this on many markets at once and even on markets on which you are not currently active. You could be trading a horse race and collecting data on Tennis match for example. I’ve done this for many years and have built up a valuable database of detailed information about the way markets act and why they act that way. I’d recommend you do the same, there are plenty of example spreadsheets on the forum which you can use to build your own tool.
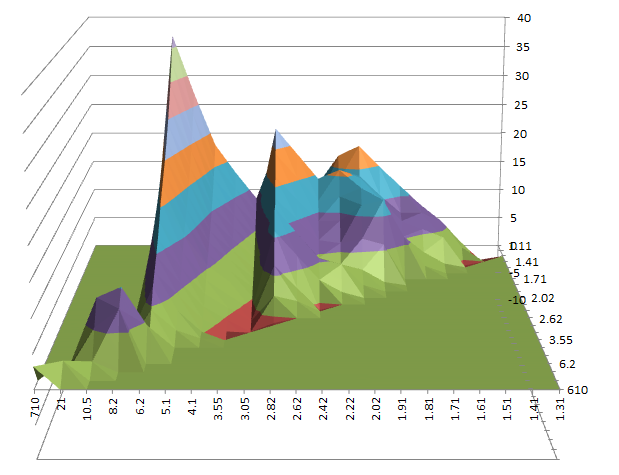
Here is something that you should find interesting, the visualisation on Almagro from the Ferrer vs Almagro match in the Australian open.
![]()
Category: Tennis, Trading strategies, Using Bet Angel


