Tag: visualising

Visualising sports trading data
You may have noticed my regular theme of visualising data. Why do I do this?
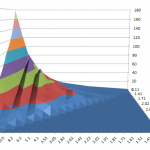
The reason is simple, it’s easy to pick up patterns when you are looking at them visually. If you have to plough through billions of rows of spreadsheets, pivot tables or outputs from a database, you may find some of the more obvious patterns may elude you due to number blindness. Visualise it and it often leaps right out at you.
Bet Angel contains a …


Connect
Connect with us on the following social media platforms.