Tag: visualisation

Profit graphs – Visualising data on Bet Angel
One ‘trick’ I use with Bet Angel uses two ‘hidden’ features. It has help me improve my trading no end, especially on unfamiliar sports.
The two features I use are the Excel link and the automation. They both work in the background for me while I trade, or even on another machine to collect data on a market I may or may not be trading.
What they are doing is pulling in data from the market I am trading which …

Visualising sports trading data
You may have noticed my regular theme of visualising data. Why do I do this?
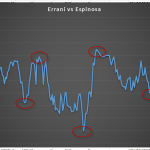
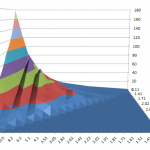
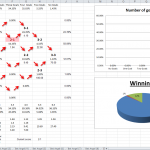
The reason is simple, it’s easy to pick up patterns when you are looking at them visually. If you have to plough through billions of rows of spreadsheets, pivot tables or outputs from a database, you may find some of the more obvious patterns may elude you due to number blindness. Visualise it and it often leaps right out at you.
Bet Angel contains a …

Clever ways to trade and visualise football data
Market data can be boring in it’s flat form format. By re-interpreting this data you can not only get a bit of depth in a market but perhaps see things you haven’t seen before. I tend to visualise data, because this allows you to look at the data in a much more intuitive manner and this means you can spot opportunties easier as it significantly aids your reading of a market.
In the embedded video we use the multi market …


Connect
Connect with us on the following social media platforms.