I learnt a long time ago that sometimes the best way to think about things is to flip them on their head.
Putting aside traditional sports betting, if you are using a popular Betfair trading strategy like “lay the draw”, the best way to solve the problem of which match to choose is, therefore, to try and find a match that will actually end in a draw. Let me explain more….
Collecting data
I have collected football (soccer) data for many years, decades in fact. When I first started collecting data I would go back as far as I could and would whack it into a spreadsheet to gradually built up a bigger and bigger database of league games. The great thing about the modern world is that football data and statistics for football matches are freely accessible and there is plenty of it, but it’s really how you use it that matters.
Multi-decade trends in football matches
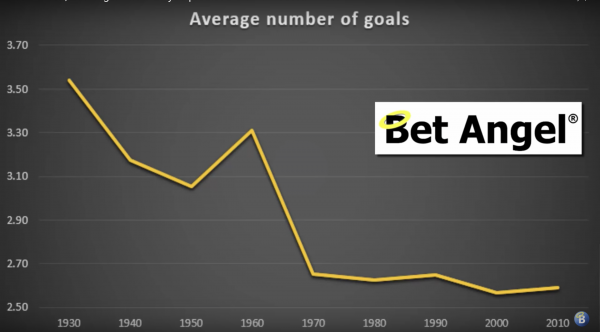
I’d like to highlight one thing to you that I remember spotting this when I first started collecting this data. The chart headed ‘average number of goals’ shows how many goals have been scored over a large number of years, I’ve cut off one side of the graph because it’s that generally is irrelevant. This is both teams to score added up and averaged.
You can generally see that’s what’s been happening in the long term over many decades. The average number of goals in a match is basically getting smaller and smaller there are fewer and fewer goals being scored in a soccer match now. You can see on the graph that it seems to imply that about 2.6 goals are about where matches have settled in the current modern sense.
This is why you see bookmakers and betting exchanges price up over / under 2.5 goals markets. They are, roughly, a 50/50 chance and this makes it a great market. Bookmakers were always there to split opinon and this is exactly what that does!
Hidden information in the football data
Now the interesting thing about that is if you actually look at the results that sit behind the 2.6 goal data and then start going backwards in history, you’ll notice that there is actually a correlation. So one of the first things that I discovered in football betting and football trading, is how to price the draw. I figured out very quickly that in fact, the draw is much more likely in certain types of matches than others.
What are those matches where a draw is less likely?
How to predict a draw in a football match
If you look at low scoring matches, the draw tends to occur much more often. If you look back at the historical data you can clearly see this. If you look at any area where the number of goals scored was quite high, you can see the chance of a draw was quite low. But as we move into the era where goals are less likely, you tend to find that the chance of the draw increases.

You can immediately form a link therefore between the number of goals scored in the match and the propensity to draw. If you break that down look at it from a deeper perspective what you will actually find is pretty obvious. If there’s a match that is likely to contain three goals you can’t divide 3 by 2 otherwise you’d end up with one and a half goals each in a match and I’ve never seen a match that has ended up 1.5 and 1.5! It may have happened in Italian football or somewhere but it’s certainly not something that I’ve ever seen in the data.
It would have to be 2-1 or 0-3 or 3-0 to either side, you can’t have a match of three goals in it and end up a draw. So, if you’re forecasting three goals then the chance of a draw drops off pretty dramatically. However, if you’re in a very competitive match as you head down towards two goals, two goals can be equally shared. So just from a purely mathematical perspective, you can figure out therefore that there is a direct correlation between a number of goals in the match and the chance of it drawing.
How predicting a draw will help your Betfair football trading
If you want to deploy that ever-popular Betfair trading strategy ‘lay the draw’. You should pick a match where there’s likely to be more goals, it’s as simple as that. Well I say as simple, we are obviously not taking account of who score those goals, but you can see we have the genesis of an process here.
But identifying matches that will be low or higher scoring, dramatically increases any yield you have on your strategy. if you are laying the draw, you really want to avoid matches where there are likely to be fewer goals then as your strategy, from a generic perspective, would be much less likely to work. This doesn’t just apply to trading, if you want some betting tips, you can see what impact goals have as well. You can also see that in historical data and how goals correlate to draws.
So it’s easy to say that collecting historical data is useless, but I find there are always some elements to it that are always interesting because they can confirm what we knew about the draw already and you can actually see that directly reflected in this data.
If you find this interesting, it’s possible to expand this in more depth and scope. So drop me a comment below if you would like me to expand these sorts of topics further.
Hi peter just read this ,do you have the spreadsheet for inputing the data and coming up with the %?
If you visit the forum there are a few examples on there now: –
https://forum.betangel.com/viewforum.php?f=6