
US Open Tennis – Scoreline statistics
US Open Tennis – The statistics behind the scorelines
Advice from Dan from tennisratings.co.uk .…
I thought I’d look at the US Open on a historical basis and look at the statistics behind the scorelines. An angle I wanted to look at for this blog post was laying players in-play when either a set up, or two sets up. As an introduction, the table below shows the percentages each correct scoreline occurred in Grand Slams since 2011:-
| Scoreline | 2011 | 2012 | 2013 | 2014 | Overall |
| 3-0 | 55.1 | 46.9 | 53.2 | 54.5 | 52.4 |
| 3-1 | 29.6 | 31.2 | 26.6 | 28.9 | 29.1 |
| 3-2 | 15.3 | 21.9 | 20.2 | 16.7 | 18.5 |
The percentages year on year do not deviate hugely. Each year, the available correct scorelines have always appeared in the same percentage order – for example, there has been no year where 3-2 has occurred more frequently than 3-1 or 3-0. However, the US Open has very distinct percentage differences to the Tour mean:-
| Scoreline | 2011 | 2012 | 2013 | Overall |
| 3-0 | 55.2 | 43.9 | 45.9 | 48.2 |
| 3-1 | 28.4 | 35.0 | 33.6 | 32.4 |
| 3-2 | 16.4 | 21.1 | 20.5 | 19.4 |
Here we can see that matches ended in a 3-0 scoreline 4.2% less than overall, with the 3-1 score the main beneficiary, with the US Open percentage rising by 3.3%. That’s valuable knowledge to traders in itself, but of much more interest to traders is how these scorelines were derived, and in particular how often a 2-0 scoreline – where a player can be laid at a very low price – is lost to a 2-1, or a 2-2 scoreline.
The table below illustrates the percentages that 2-0 scorelines develop in different ways, for the two hard court Grand Slams from 2011 to 2014 (Please note that the 2-0 -> 2-1 and 2-0 -> 2-2 percentages are percentages of the 2-0 match total, not the completed match total):-
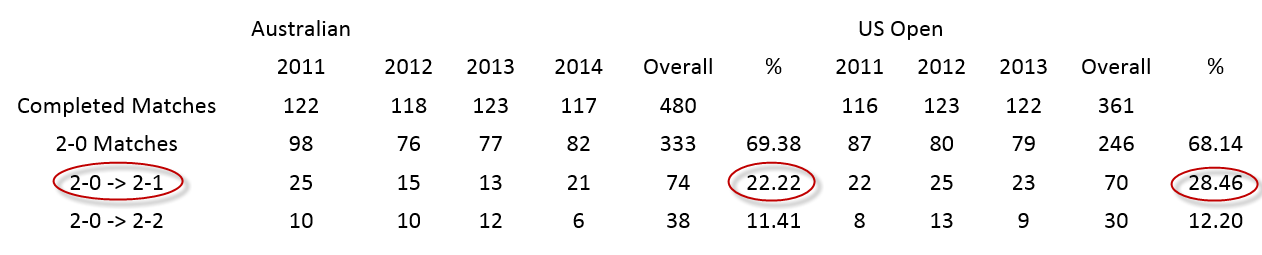
Having said this, there’s a marked rise in the success of the player that is 2-0 up losing in the third set at Flushing Meadows, with 28.46% of matches going 2-1 after they went 2-0. On that basis, laying a player 2-0 up in sets has much more historical success at the US Open than at the Australian Open, and this should be a decent low-risk trading opportunity. As we can see from the statistics above, the US Open has a very similar percentage of matches where one player takes a 2-0 lead (68.14%) to the Australian Open (69.38%).
Interestingly, combining the two tournaments together, the player who recovered from 2-0 in sets to 2-1 won the 4th set 68/144 times (47.22%) so there’s very little edge to either player with regards to momentum in a 4th set. However, with the US Open worse (42.86%) for the losing player winning the 4th set than the Australian Open (51.35%) I’d be less inclined to let a lay of the player 2-0 up run throughout the 3rd and 4th sets, and an approach where a player is laid at 2-0 up and some hedging is performed if the match goes 2-1 in sets looks to be the best strategy.
These numbers support the previously mentioned high percentage of matches in the US Open ending in a 3-1 scoreline. With matches at the Australian Open ending 3-0 much more often, the oppressive heat of Australia in January is likely to play a big factor, with players more likely to give up at 2-0 due to the herculean effort required to turn around that deficit in such conditions. With the weather likely to be around the mid 20’s next week at the US Open, this will be much more comfortable to the players and this should enable players to give their best efforts for longer.

![]()


