If you are Betfair trading, it’s important to look at the Betfair charts. While some sports don’t suit charting, they are especially useful if you are trading pre-off horse racing markets. They plot price action and give you some idea of where the general trends are in the market.
However, there is a problem with Betfair charts.
The big issue is that they cannot correctly plot an accurate price history. It’s been a problem right from the day the Betfair betting exchange came into being, and even with updates and changes, it seems the charts have become more broken!
This blog post will explore why this is the case, and I’ll provide a solution to these broken charts.
Why can Betfair charts be unrepresentative?
To begin, we need to look at how the Betfair charts record their data.
Firstly it is important to note that a Betfair chart is actually generated over many hours. So what you’re actually seeing is deeply compressed information.
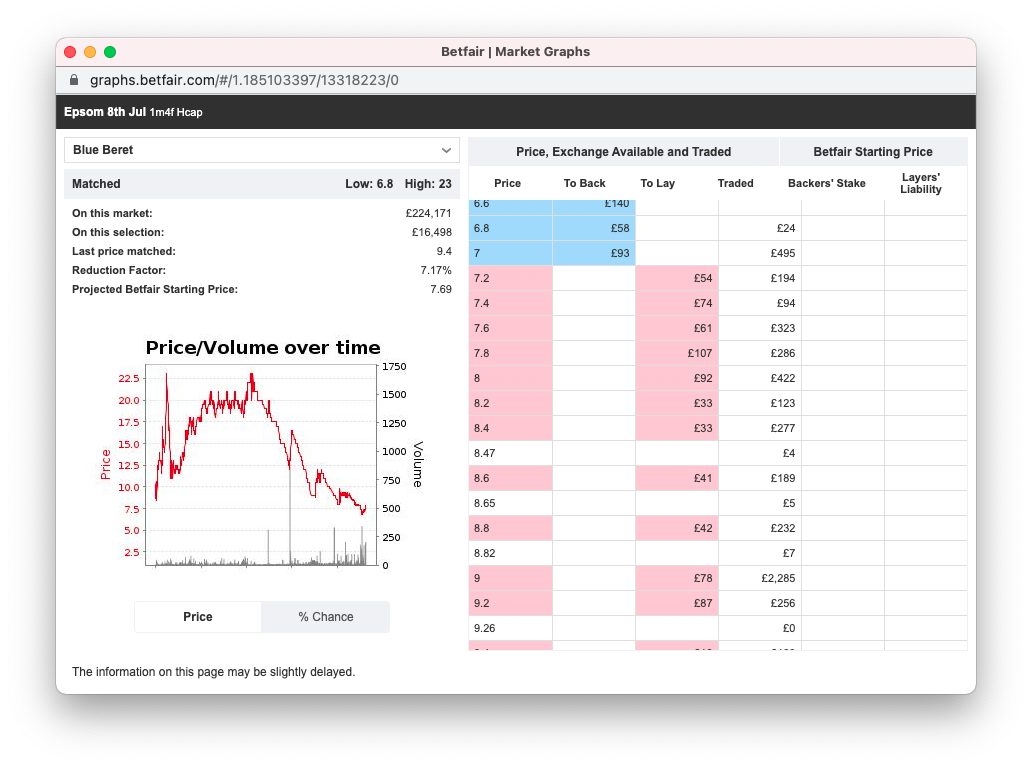
If something from the market open starts to get shorter and shorter over a very long period of time, a normal graph would show a nice gentle slope as money comes for that particular runner.
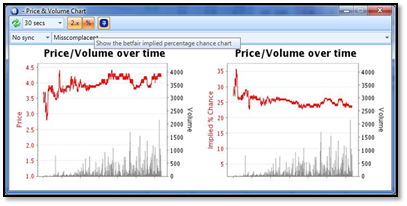
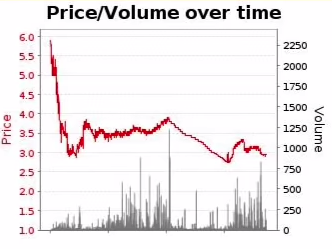
However, when you look at a Betfair chart, the moves are a lot more exaggerated. Hours of movement appears on the left quarter of the chart and the right half is just minutes.
Betfair’s failed attempt to fix the broken charts
A couple of years ago Betfair tried to fix this, however, another problem occurred which completely broke the charts! The charts sometimes decided they would display the wrong information and in some cases, the charts even decided to go backwards.
The most common issue was that when a large bet appeared, these new charts showed prices that would erratically jump from one price to another resulting in the time scale along the bottom being completely wrong.
It’s no surprise that all these strange things have resulted in nobody being able to trust them. So be careful if you’re using the standard Betfair charts because they are broken. Betfair indicated that they will fix it, but I’m not completely sure when that will happen, if or how.
Betfair’s new attempt to fix the broken charts
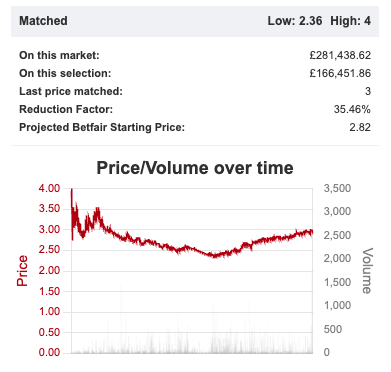
In August 2022 Betfair attempted to redesign the charts again and this time they left a few bugs that we previously discussed, but introduced a new one, by failing to scale the vertical axis of the chart.
This made it even harder to understand and get an accurate read.
So my advice to you…
Use advanced charts because they’re just so much better!
You can delve into so much more detail, creating a customised chart for your style of trading which can give you a unique view of the market. But also you can zoom, pan and scroll across the chart over time. It will allow you to look deeper at specific moves and learn what happened and why.
It’s really easy to import and export your own customer advanced charts and to make life even easier for you, you can download some of the examples on the forum: –
https://forum.betangel.com/viewforum.php?f=67
There is a whole world to explore in there!
Bet Angel advanced charting: the smart way to use charts
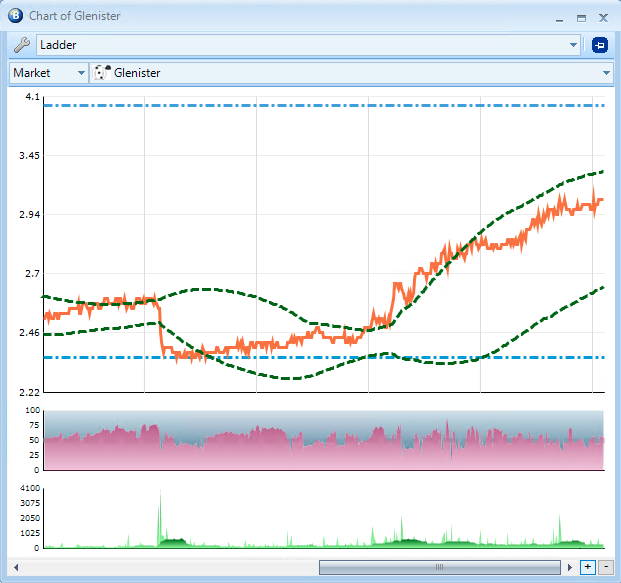
One of the first things we ever did in Bet Angel was to introduce our own chanting, and it is something we continue to upgrade and enhance. Advanced charting allows you to overcome all these issues and significantly improve your trading by displaying tons of customisable information right in front of you.
The advanced charts give you a true plot of all of the price activity, and you can scroll forwards, backwards and zoom and pan. This makes it possible to be able to see everything that’s going on with the market in the correct time frames.
Even better than that, on version 1.55 or higher, you can create and plot your own data on a chart using automation to store calculated data. This gives you the ultimate control over other charting options! It seems like a no-brainer to pick the detailed and advanced charts over the basic, broken Betfair charts when trading.
Charting is such an important tool when trading, especially pre-off horse racing. I would recommend that you become familiar with the workings of advanced charting and remember not to rely solely upon Betfair’s charts.
But also, use them to create your own unique view of the market. Something that only you are familiar with. Doing this will help you get an edge in the market.
If you want to learn about advanced charting in more depth, check out this video.
Thanks Peter, I am really interested in learning to read the charts for pre-off horse racing. I’ve seen lots of material about the endless opportunities of advanced charting, and how to create them, but I haven’t really come across much material about how to read them. If I create a MACD, what triggers am I looking for? WoM seems to change so quickly that by the time I make a move its often changed and gone against me. I often think I’d be better taking a read of what I am seeing and doing the opposite! Do you have any material that I have missed on reading charts and identifying opportunities or is this something you could potentially do a video on? Many thanks, Steve
Quite a few sites on the internet suggest what use you should make of technical indicators. But I’ll admit I don’t really use them in that sense. I tend to use charts to support my decision-making on a trade. So that will be different on a competitive handicap, where I expect the market to be range bound to a market trending firmly.
I’d not recommend one specific use for one specific chart or indicator as there are so many set-ups and uses for the many features on the charting. So I’d recommend that it supplements your decision making, rather than specifically informing it. That’s how I use it anyhow.