
Why does a strategy fail the moment you use it?
You know the feeling, you work hard to research and establish a new idea or strategy. You put it to use and it works, so you raise your stakes and booooooooom, it instantly reverses and losses you a shed load of money. It can sometimes feel like the market has got it in for you or like somebody is watching you.
You don’t deploy a strategy to lose money
When you set out to deploy a strategy you don’t expect it to lose, so if you start doing something and it losses money you very often cut it loose. It doesn’t make money so why keep doing it? Typically a market participants response to a loss arcs back to an age when avoiding losses were much more important. What’s this glowing warm thing in front of me? What happens if I touch it? Ouch, that burns, I’m not going to touch it again.
If you start losing money, you tend to pull the plug pretty quickly and there ends your strategy, experiment, or idea.
A loss feels bigger from a winning start
So you deploy a strategy and it starts to produce good results so you increase stakes, then a little bad run, then a bigger one and suddenly you find yourself heading to breakeven. If fact because you increased stakes you evaporate your prior profit much faster than that it took to make it. But that’s OK as you expect things to swing about a bit. But then the breakeven becomes a loss and that gets bigger and you quit. You can’t believe you were up so much and ended up losing money.
The reality
The reality of the situation is that only over a very large sample set and with a consistent staking plan can you reliably get a decent picture of how a strategy will play out. Cut out too soon and you will never learn the true character of a strategy. But most pressure is brought to bear when you make a loss quickly or you lose a profit. It’s almost impossible at that point to keep going. All strategies have drawdowns however and you can’t really predict when they will occur, so to bail when one occurs means that you may cut a loss for sure, but you are also cutting out profitable strategies that have yet to mature as well.
The net effect is that good strategies get chucked out along with bad ones just because you started them at a moment when the strategy dipped. On the inverse side you may get a lucky run with a poor strategy which then reverts to mean. So you successfully catch all the negatives and few positives.
My approach
I don’t have any pre-defined sample size to follow for defining whether a strategy works or not. I know they exist but, as with all academic led material, other metrics may distort the results.
For example, in racing there are a number of metrics, distance, course, seasons, etc, any one of those could distort the true path of your returns. If you slap on a X size sample you can fall foul of those metrics. One may perform well just because it coincides with one of those metrics.
So I look at very long sample sizes, use a carefully defined staking plan and measure the variability of returns. At the start the variability will be high, you will swing positive or negative for a while, but before long that variation, usually return on total capital invested measured as a percentage, will revert and stabilise to a particular number. It’s that number that I am seeking, hopefully a positive one!
I currently have two new strategies that I am putting to use. I knew fairly quickly I was onto something when the variability settled positive, so at that point I carefully looked at the reason for the positive variability. Both had positive and negative traits to start but I just kept on plugging away at small stakes until it stabilised. Even on small stakes I’m happy to let something slip quite negative if the overall variability hasn’t settled. Once I’m satisfied that I can explain the reasons it’s positive, I put it to use. But if it never goes positive on a percentage return basis then I need to rethink.
One thing you also notice is that all sports and therefore strategies exhibit some seasonality. Therefore, unfortunately, it may take a full year before you fully understand properly how something works.
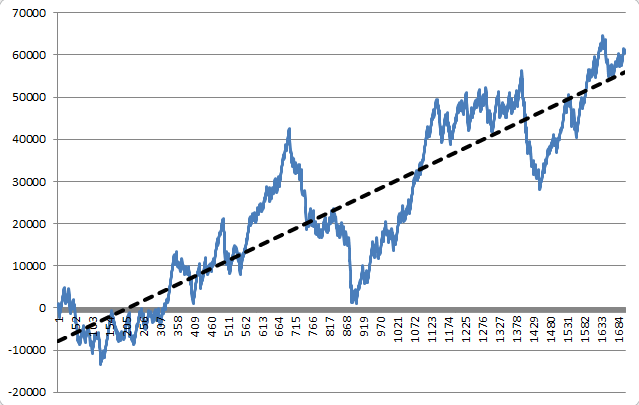
If you want a view on this topic, have a look at this post. This is at the higher end of variability so you usually won’t seem something as extreme as this, but I was playing a certain game with this strategy. None the less you can see it’s profitable, but you could have easily fallen foul of the traits I have explained by not thoroughly testing it. It would have been another situation where a strategy ‘failed’ but in fact you just never gave it enough time to fully mature. I’ve reproduced the graph for you.
![]()
Category: Psychology, Trading strategies


Very interesting as always Peter . I deployed an automated horse racing strategy which involved laying in running under certain conditions. Following advice from you on measurement of performance ( total cum profit as % of total cum stakes ) with small stakes I returned 0.2% positive after around 1000 races. I stopped at that point becuase I thought te return was too small and could easily quickly go negativeand I was worried that I would not get matched at higher stakes and this would affect the outcome. Are you able to tell me if 0.2% is a very low return or not ?
Based on your article I may revisit it as maybe I did not give it enough time and could have tweaked it more to make it more effective.
Ps – it settled down to 0.2% after about 500 races so seemed stable.
Any +ve will do IMHO, some of the pre-off stuff only yields tiny returns on stake, maybe as little as 0.10%; so I wouldn’t rule anything out with a low return.
I have seen you post this graph elsewhere, I believe it is over a period of 6 months. However, can you explain the numbers in the horizontal axis?
Also, I am curious as to the middle bit where profits plunge fron 40k to near zero. Then back upto 50k a lot quicker than it took to get to the first 40k. Did you have to rethink your original strategy at that point?
deeppockets,
Axis along the bottom?, amount of markets traded perhaps?